What’s it all about
Hey! Today, we’ve rolled out Timeline, a new feature that helps you understand what’s happening inside companies without digging through endless updates. Think of it as your shortcut to clarity: one view, zero noise, and all the context you need to spot patterns before anyone else.
The Timeline feature lets you pick any date range and instantly see the company’s activity across that period: news releases, key hires and departures, spikes in open roles, leadership shifts, and changes in core metrics on a single graph.
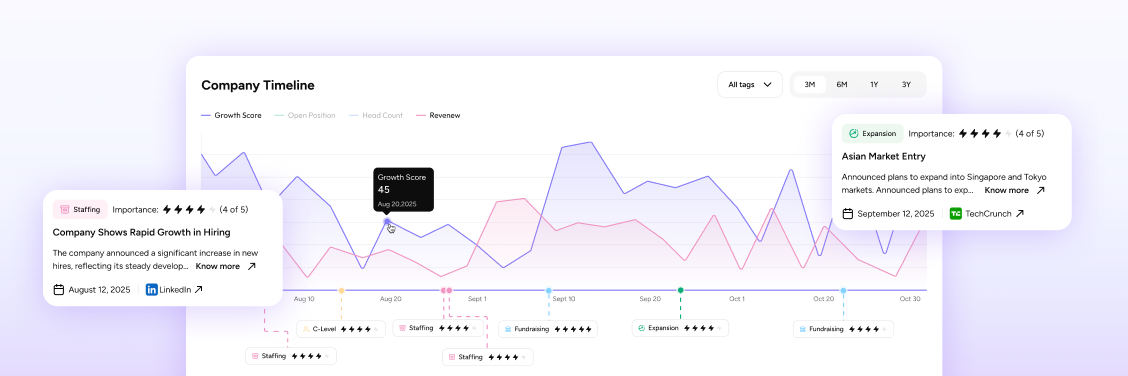
We’ve also added to Timeline a Grow Score feature, an easy performance indicator that measures a company’s current growth momentum. Grow Score combines signals like funding rounds, key milestones, and hiring patterns with TrajectoryAI’s predictive models to deliver a forward-looking performance indicator.
Scroll below the graph, and you’ll find scoops: internal insights ranked from 10 to 1 that explain what actually moved the numbers, and Timeline turns scattered signals into a story. To cut a long story short, if you want to understand not just what happened, but why the metrics shifted, this is the feature you’ll end up using every day.
How does it translate into value? Timeline helps sales managers spot signals that drive new deals, gives investors a read on momentum and risks, and lets account managers gauge client stability. And if you’re a CEO, it offers a clear view of how leadership moves, hiring shifts, and market changes impact performance. What’s more, Timeline helps reveal meaningful patterns, and the trends seen in one company can often be used to anticipate similar developments in others.
Have you tried TrajectoryAI yet? If you’re in marketing or sales, if you’re managing key accounts, if you’re investing in growth companies, or if you’re a founder trying to stay ahead – this is your tool. TrajectoryAI gives you the intel, you make the move.